Suppose you are out trying to buy a new processor, memory stick, storage device for your computer, or even a whole new computer. If you go without checking out the performance of the devices available in the market, you will have a hard time figuring out which device is better or what suits your needs. Most of the time it is not suitable to rely on the manufacturer's vendors' verdict completely.
So, whenever there is a new architecture or device in the tech ecosystem for use by the general public, it is necessary to check whether it can outmatch other such devices or even perform as the vendor or manufacturer claims it to. This helps the public decide what to choose given a list of choices in the same category of devices. To make it easier for the public and tech enthusiasts, software developers have created a set of tools that perform common tests on all the architectures. These tests generate a result based on the results of the tests. There are multiple metrics under evaluation in these tests. But to make things easier for the public, software developers configure these tests to generate a common number which is called the result or "score" of these tests. This testing is called benchmarking and the software that is used to run these tests is called benchmarks.
Here the benchmark under consideration is named Coremark.
What is Coremark?
Coremark is a benchmark written in C programming language and is used to test the performance of a processor's computation power. To make things simpler and not make it sound like rocket science, coremark runs a series of iterations on the given processor and measures the number of iterations run in one second. It also measures the total time it takes to run all iterations of a single test.
Benchmarking Environment
The environment under which benchmarking is done is different for different devices. As there are many factors in a device that can cause the results to be different than the normal ones, so here I have chosen more than one count of each device based on the availability of each device in the inventory at the time of performing tests. Afterward, once the tests are performed, a geometric mean of all the results is calculated which gives us a single result for each device type. Here the devices under consideration are as follows along with their operating systems:
| Device Under Test | Count | Operating System |
| StarFive VisionFive v1 | 3 | Ubuntu 23.04 |
| StarFive VisionFive v2 | 5 | Ubuntu 23.04 |
| SiFive HiFive Unleashed | 2 | Ubuntu 20.04 |
| Intel Core i7-6500U (Dell 5559) | 1 | Ubuntu 20.04 |
| Raspberry Pi 4 model b | 1 | Debian 11 |
The GitHub fork which contains the source code used for this whole benchmarking is available at https://github.com/alitariq4589/coremark
The coremark test is compiled first on a single RISC-V architecture and then the compiler binary is copied to all the compute instances. This is done because one binary ensures that all the factors involved during the compile process are the same. One other thing to note is that all of the devices may not support the same version of the compiler which can cause differences in the compile-time optimizations causing the tests to be different than the normal.
There are multiple number of iterations chosen for a single test and then there are multiple number of times test with single iterations run. This ensures in mitigating the test result which involves any sort of anomaly. A single result is calculated for multiple tests of a single iteration, and afterward, those results of each iteration are further passed from the geometric mean to get a single result that calculates the score for a single device-under-test.
The number of iterations chosen and the number of times a test with those iterations is run are as below:
| Number of iterations chosen for test | Number of times that test will be executed |
| 200000 | 5 |
| 400000 | 5 |
| 1000000 | 5 |
| 2000000 | 5 |
| 4000000 | 5 |
| 8000000 | 5 |
As this benchmarking involves multiple iterations and tests of each iteration type, the test is performed on all of the devices using the Cloud-V dashboard (see dash.cloud-v.co) which keeps track of all the runs and also stores the console output for anyone to check on later.
The complete information on the run is located here
Compiling the Benchmark
As explained earlier, to keep things consistent across all the compute instances, the benchmark source code is compiled on a single RISC-V compute instance. The compiler used for the compilation of the benchmark was GCC 13.1.0.
The following command is used for the compilation of coremark:
make -j4 OPATH='PATH_FOR_STORING_BINARY' ITERATIONS=NUMBER_OF_ITERATIONS CC=gcc PORT_DIR=linux/ RUN=
The ITERATIONS=NUMBER_OF_ITERATIONS does not matter as we will mention iterations separately later. This argument is usually given because make command also executes the binary immediately after the compilation is complete and the NUMBER_OF_ITERATIONS is passed to that execution command.
This command generates binary of coremark
Executing the benchmark
Before executing the produced binaries, I had to transfer them all to the relevant compute instances. For transferring them, I used the traditional scp command. Once they were transferred to the compute instances, the rest of the job was done by the automated CI script created for Cloud-V. This is mostly just the simple Linux scripting with a bit of information about stages and compute instances on which the run will be performed. I will not go into further details, if you are interested in understanding, how this is done, feel free to visit the documentation page of Cloud-V.
To make it short, the command used for the run in the CI script is of the following form:
./coremark 0x0 0x0 0x66 <NUMBER_OF_ITERATIONS> 7 1 2000 > <OUTPUT_FILE_PATH_AND_NAME>
The execution strategy is as follows:
- There are a total of 6 types of iteration count
- Each iteration count's test will be performed 5 times.
- All the tests of each of the iteration count are passed through geometric mean to get a single mean test result for each iteration
- All the mean test results of each iteration are further passed through geometric mean to get a single benchmarking result for a single device
This hassle is done to be sure that the results don't have any kind of anomaly in them
Results
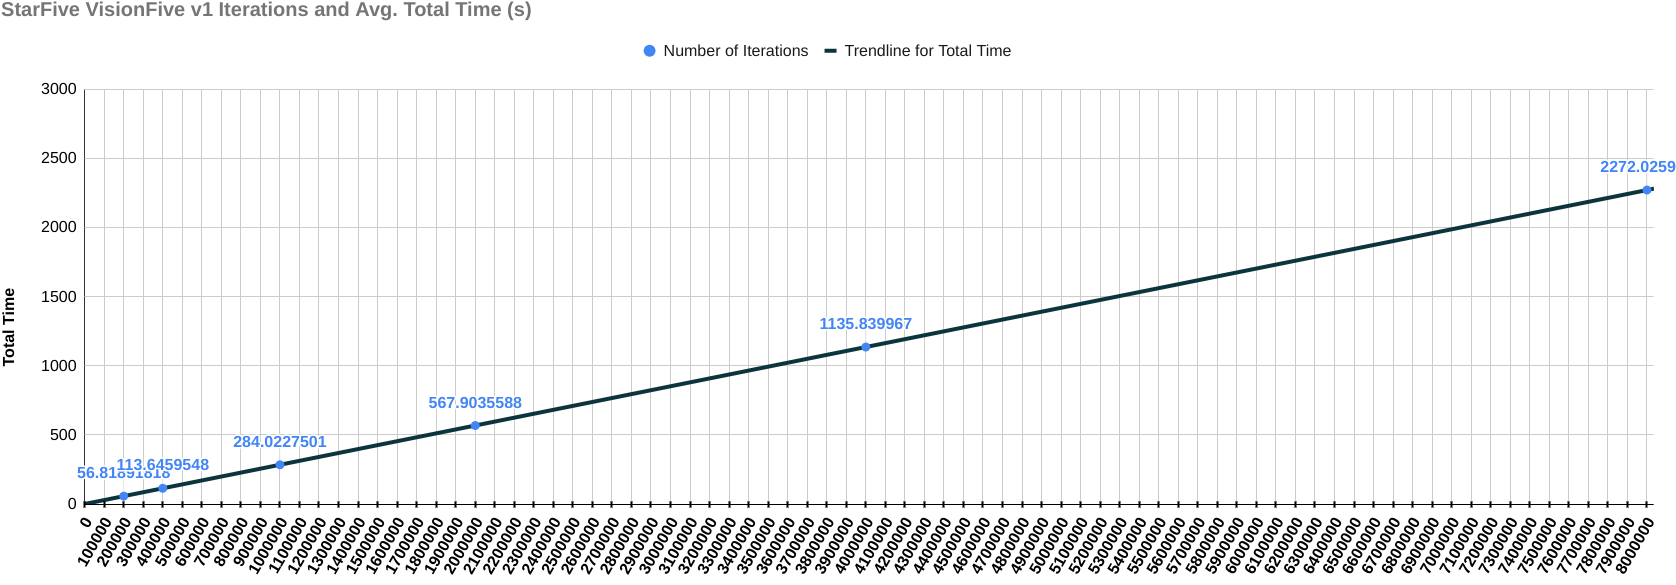
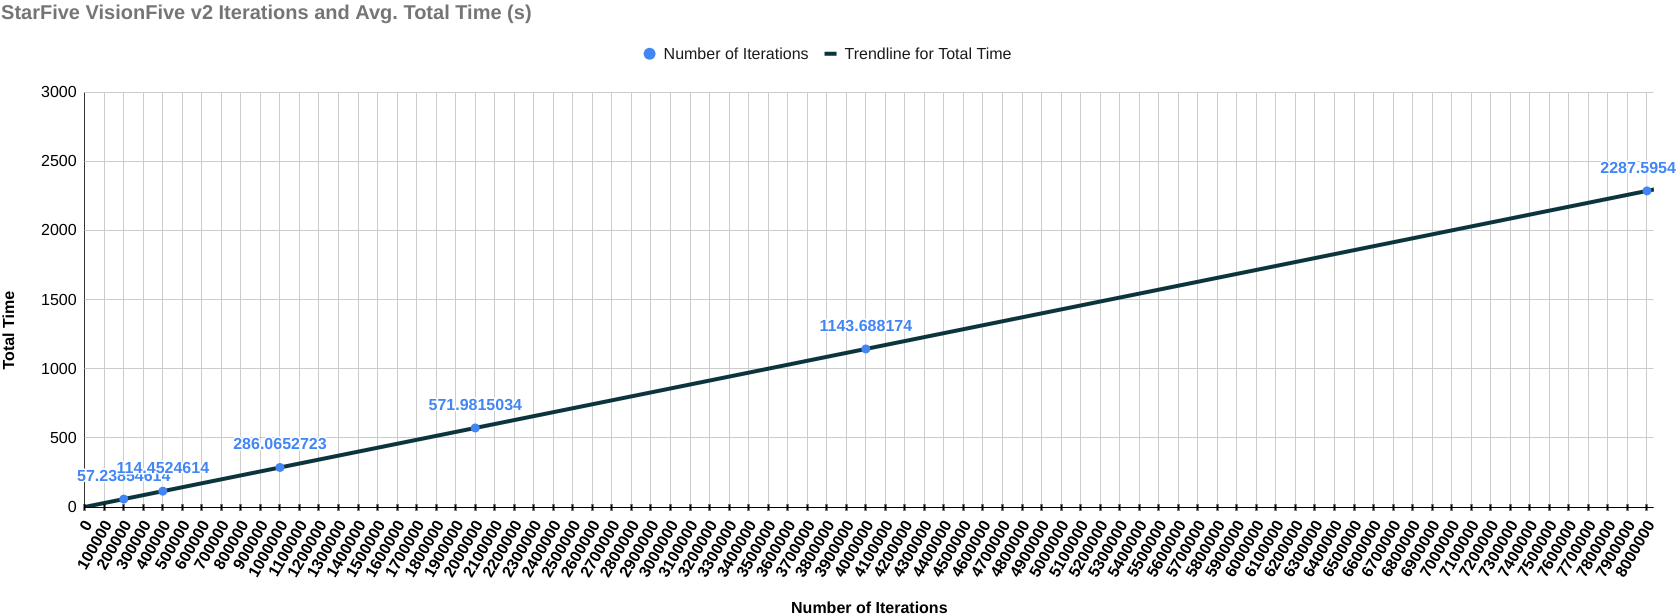
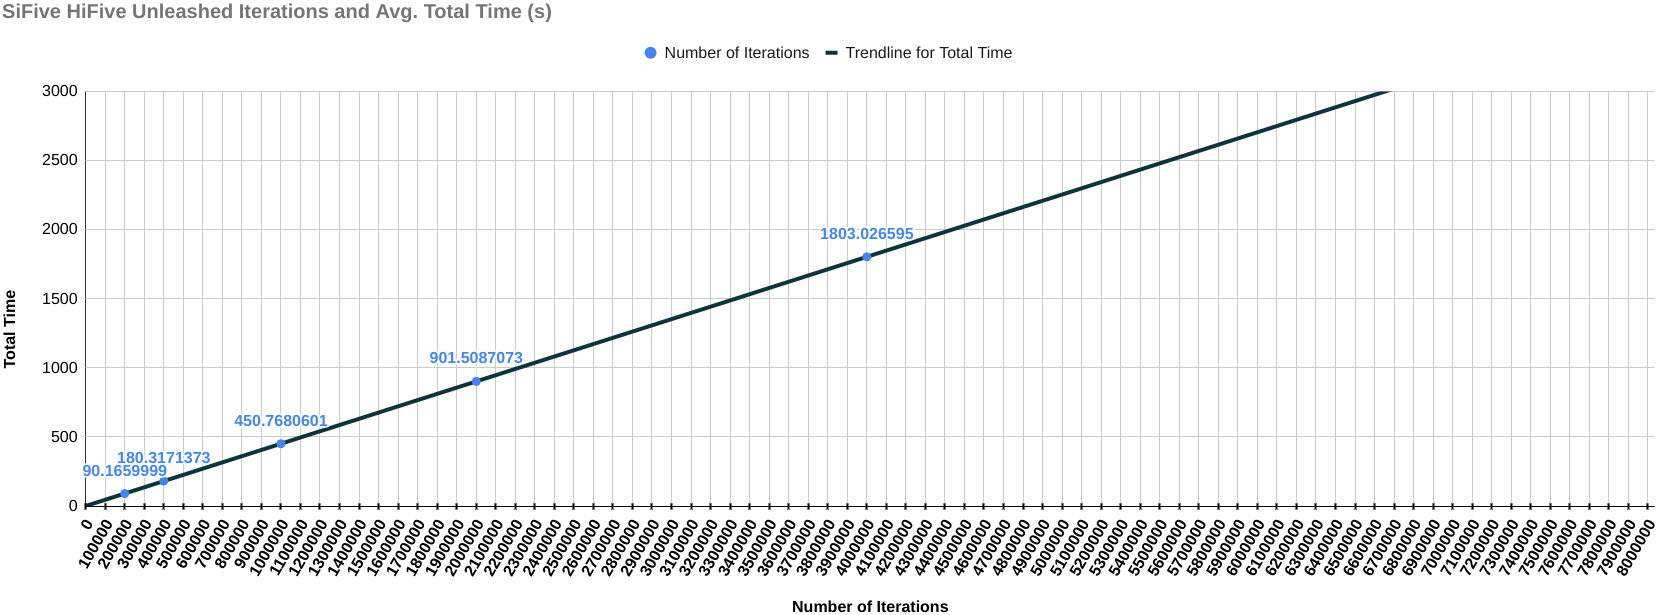
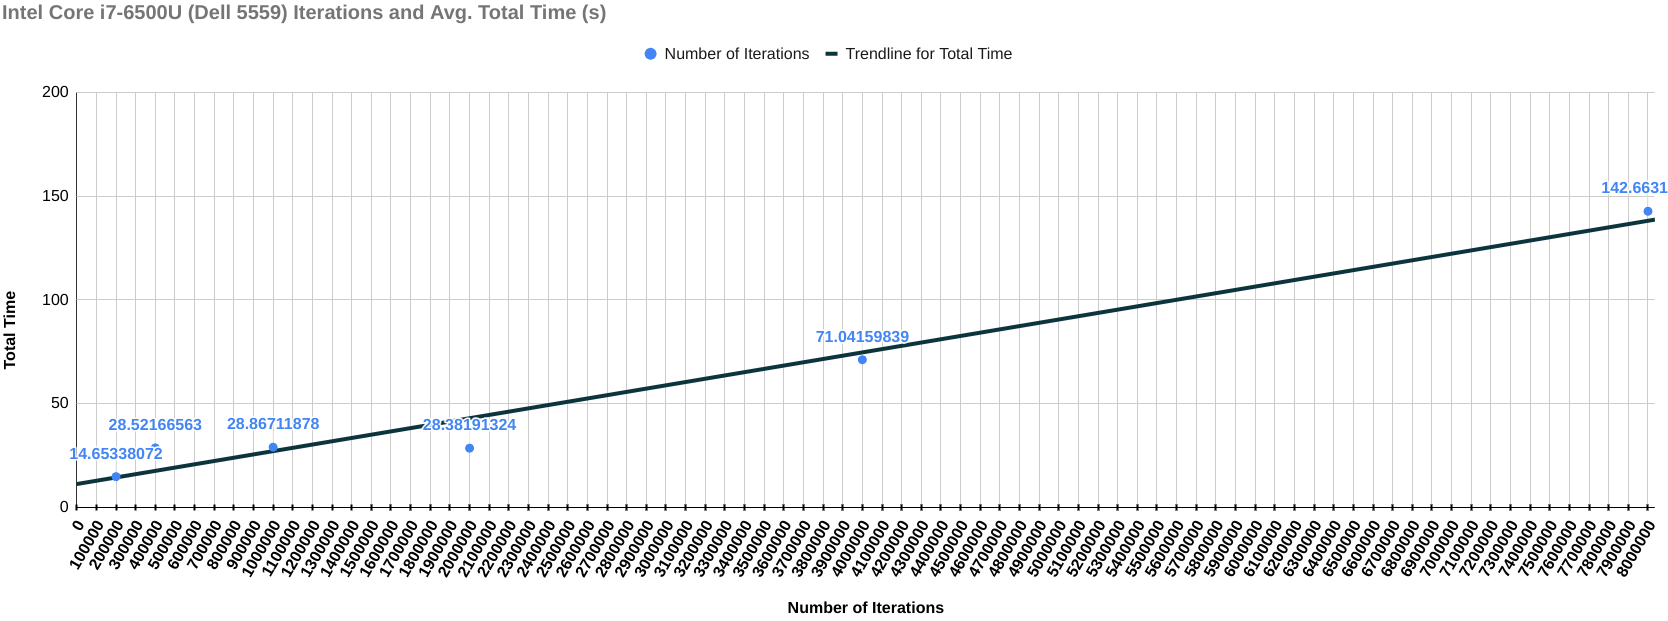
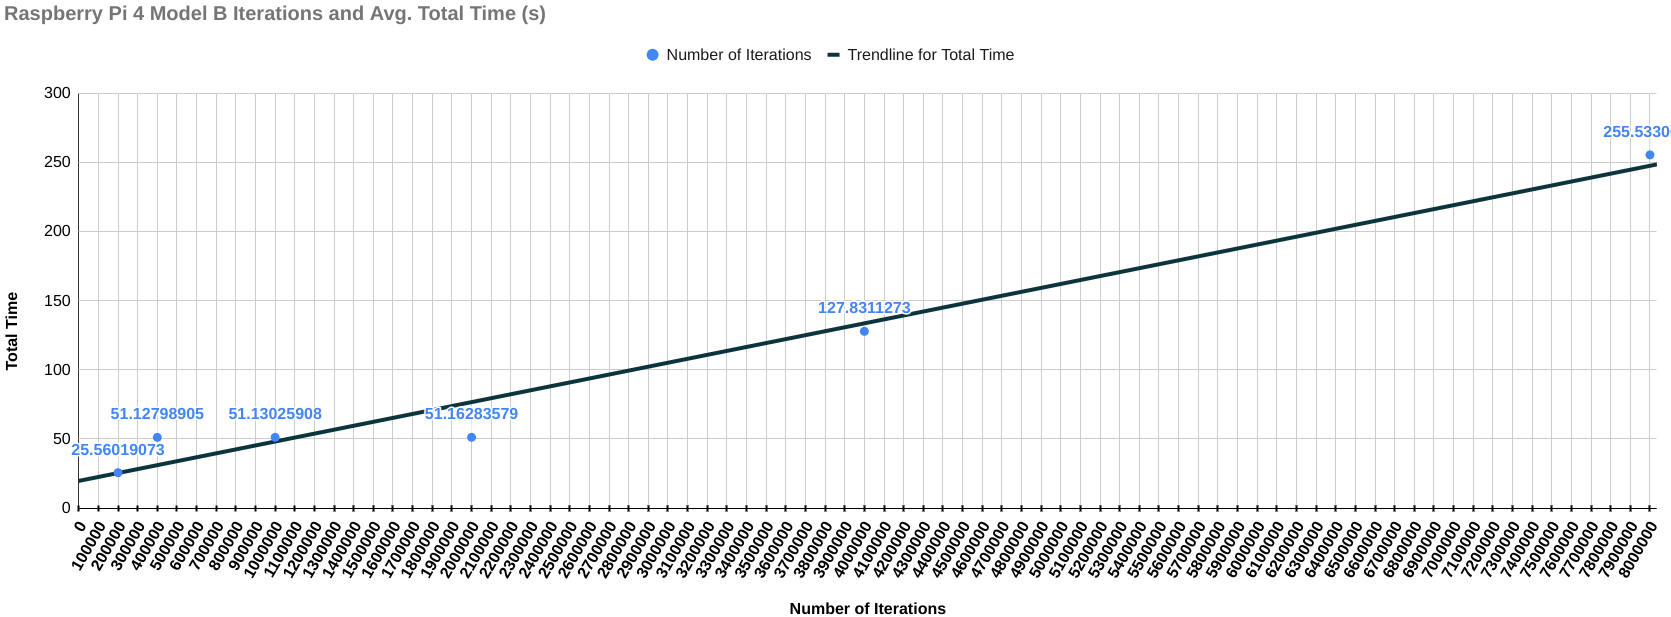
The following results include the final score of each device with the graph of the total time it took for each iteration (on the y-axis) over the number of iterations (on the x-axis). This graph is to check if the change in the amount of time is the same throughout the benchmarking process. If increasing the number of iterations negatively affects the performance of compute instance, then there should be steep curve going upwards indicating that the compute instance is starting to heat up and the performance is degrading, else it will remain a straight line.
The results of the benchmark of compute instances are as below:
StarFive VisionFive v1
Final Score (Iterations/second): 3520.8226
Final Score (Iterations/sec) / MHz: 2.934018849
Graph for Total Time taken vs Number of Iterations
StarFive VisionFive v2
Final Score (Iterations/second): 3495.9916
Final Score (Iterations/sec) / MHz: 2.330661044
Graph for Total Time taken vs Number of Iterations
SiFive HiFive Unleashed
Final Score (Iterations/second): 2218.364384
Final Score (Iterations/sec) / MHz: 2.218364384
Graph for Total Time taken vs Number of Iterations
Intel Core i7-6500U
Final Score (Iterations/second): 14568.4204
Final Score (Iterations/sec) / MHz: 4.699490459
Graph for Total Time taken vs Number of Iterations
Raspberry Pi 4 Model B
Final Score (Iterations/second): 7823.182729
Final Score (Iterations/sec) / MHz: 6.519318941
Graph for Total Time taken vs Number of Iterations
Overall Performance Chart for Iterations/second
Conclusion
All the tests are performed multiple times and their geometric mean is calculated just to ensure that the test environment remains error-free. As you can see from the graph throughout the benchmarking process, the performance of every compute instance remains the same as there is a straight line. However, there is one thing that needs further investigation. That is, the score of VisioFive v1 comes out to be higher than the score of VisionFive v2 SBC which should not have been the case given the fact that VisionFive v1 has a clock frequency of 1.2GHz and the clock frequency of VisionFive 2 is 1.5GHz. This will surely need a follow-up blog. Till next time...
Resources
GitHub Source Code Repo
Pipeline Script for Execution
Cloud-V Build link containing all the runs of benchmark